
EOM Reports
Studio Survey provides a set of tools for generating data and volume calculation results for end of month open pit survey reports.
Survey data is added to the survey database, organized according to its survey date. Depending on how it is added, it becomes available to one or more of the EOM reporting tools.
Each reporting tool will generate 3D cut and fill volume data according to the bench definition for the selected reporting scope. Some reports (such as EOM Pit, Compliance to Design and Compliance to plan) allow you to constrain your report scope to a particular contiguous group of benches. During EOM data generation, you have the option to remove trivial data fragments that you don't wish to contribute to reported mined/underbreak/overbreak volumes and so on.
Once EOM report data has been generated by one of the various reporting managed tasks, that data is used during publishing to create a report and/or plot (depending on the report type that is published).
Note: you can also load a generated report as a plot sheet using the Browse Database tool, should you need to fine tune your layout or content. You can also export your edited layout and projection settings as a new template, using proprietary plot template functions. Multiple page reports are listed as a template per page in the Browse Database listing.
EOM reports are formatted according to an Excel or Plot template that resides within your database. Typically, these templates are configured by your system implementer.
You can generate multiple reports on the same day. Each report will be labelled according to its time of generation.
Access to EOM reporting tools is provided by the Survey Reports ribbon.
Click a link for more information about a particular report:
- EOM Actual report: calculate cut and fill volumes representing the volumes mined within a time period. This is calculated both as the increase in overall void and the difference between two nominated time periods. Typically, it is used for end-of-month actual results. See Pit Actual Report.
- EOM ROM report: generate a survey report and corresponding wireframe representing a stockpile volume for a given reporting period. Commonly the volume calculation will relate to the full volume of the stockpile, although a report can be generated for any two stockpile surfaces. See EOM ROM Report.
- Compliance to Design report: assess the correlation of ground data for a given period versus the designed/expected outcome for the same survey period. See Design Compliance Report.
- Compliance to Plan report: assess the correlation of ground data for a given period versus the predicted end-of-period surface. See Plan Compliance Report.
- Calculate Blast Volume: generate a blast volume report, per-bench/level with totals, based on input blast data and constraining boundaries (with expansion control). See Calculate Blast Volume.
- Development: generate an underground EOM development report. Compare previous with current development progress and link excavated volumes to planned drive design strings. See Development Report.
Note: All reports are appended with the name of the PC and user account in use.
Cut & Fill Operations
One key data that is reported monthly is tonnage and volume extraction. This not only provides a clear view of the life-of-mine progression, but also confirms payments to mine operators. Another use of this data is a comparison of extraction against the original mine plan and (separately) against the 3D mine design. This covers the essential mining reports for open pit scenarios, with development, drive compliance and stope extraction reporting supporting the underground situation.
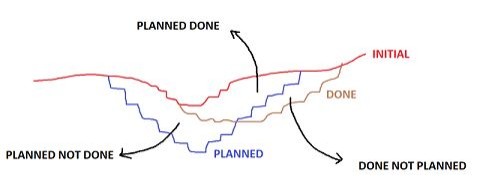
Studio employs "cut and fill" calculations to ensure the calculated volume of extracted solids is accurately recorded and compared with the plan or design. This is the core business benefit of Studio Survey. The goal is to isolate key volume data such as:
-
Volume and tonnage extracted in a reporting period for a pit/area or decline/area/level.
-
100% correlation with plan or design = "planned done" volume.
-
Partial correlation with plan or design meaning discrepancy volumes exist:
-
Planned not done
-
Designed not done
-
Done not planned
-
Done not designed
-
Other volumes satisfying multiple criteria (planned done but not designed, Done not designed but planned and so on).
Note: Survey volumes are reported automatically according to the Excel or Plot template associated with each reporting run. See EOM Reports.
-
Examples of key EOM reporting concepts
Studio Survey EOM reporting tasks run cut and fill operations automatically, but you can also access the 'raw' tool on the Wireframe Tools ribbon >> Process >> Cut and Fill Volumes which can be useful for running checks against new data before subjecting it to the EOM reporting tasks. See Cut and Fill Volumes.
Cut & Fill Input Data
In EOM reporting of open pit scenarios (Pit Actual, ROM and so on), a minimum of two surfaces are specified in order to calculate extraction volumes. These minimum criterion depend on the task being run:
-
Pit Actual reports – A current and previous surveyed surface are required to calculate monthly volumes extracted. A topography is necessary if you are to report cumulative extraction results and to generate a "check volume" based on the initial topo.
-
ROM reports – ROM stockpile reports are similar in that a previous and current surface are needed. You can also specify a ROM base surface for cumulative reporting (total ROM volume, for example). You can also optionally constrain reporting within a stockpile boundary.
-
Design Compliance reports – A designed pit surface (such as an automated pit design from Studio OP, for example) is mandatory, as is the surveyed pit surface. Again, a constraining boundary can be specified.
-
Plan Compliance reports – A scheduled end-of-period pit surface (from Studio OP, for example) is required, as is a surveyed pit surface. In this report, you can also specify the previously surveyed surface (from the previous month, for example) and again, a constraining boundary if you need one.
-
Development – Surveyed current and previous solid shapes are required, and a boundary string is optional. You can also create a summary report containing the results of multiple development reports.
-
Drive Compliance – Designed underground solids are required. 'Actual' results are derived from either existing development reports or manually selected from loaded data or physical files.
-
Stope – A stope scan is mandatory, as is a designed solid. You can also include upper and lower surveyed solid data. A summary report is also available.
-
Memo – Surveyed and design string data are mandatory, with some options requiring additional specification of laser arrangements. A summary report (known as the "memo register") is also available.
See Cut and Fill Volumes Example.
Report Output File Naming Convention
Output files from Studio Survey's reporting processes follow the same file naming convention. This is adopted to make files more easily recognizable outside of Studio Survey, and to make searching for them easier.
The following conventions are used
for reports:
Open pit
scenarios:
Report_<pit>_<area>_<rom>_<date>.xlsx
For example:
Report_Pit_1_Area_1_ROM_1_2020-03-23.xlsx
The following conventions are used for output data:
Open pit scenarios:
<data type>_<pit>_<area>_<rom>_<date>.dm
For example:
NaturalSurface_Pit_1_Area_1_2020-03-24_tr.dm
Batch Processing Reports

In Studio Survey, you can either run reports directly, using one of the EOM reporting tools available on the Reports ribbon, or you can add a report to a queue for batch processing later. This facility is available to any report where no interaction with the 3D window is required.
This facility is currently only available for open pit survey scenarios.
The following tools have a batch processing option:
In each case, you set up a report (or publishing step) as normal, defining the scope of reporting (data, dates) and then, instead of calculating the associated cut and fill volumes and output evaluations, you select Add to Batch instead.
Once added, a report is displayed in the Run Batch task where it can join a queue of others. You can also manage the contents of the batch run here, including the order of tasks and task removal.
Related topics and activities